The Connecticut Trail Census facilitates the collection and use of two types of data: count data (# of uses) and intercept survey data (user behavior).
- Count data is collected by infrared TRAFx counters set up on each participating trail site.
- The counters have sensors that can detect a change in temperature passing by the counter.
- Each time the sensor detects this temperature change, it registers this as a use
Count Data Reports
2021 Aggregated Count Data Report
 11, 2022 – The following report includes the final adjusted infrared (IR) counter data from 20 multi use path locations in CT for 2020.
This is the fourth year of counts for all locations, except the Riverfront Recapture site in Hartford (added in late 2017) and three new sites: the Air Line Trail in Portland; Charter Oak Greenway in Manchester; and G & S Trail in Groton, (all added in summer 2019) and Bluff Point State Park added in 2020. Trail counter technical issues at the Naugatuck River Greenway in Derby resulted in less than 3 months of usable data, therefore this location is not included in the 2021 aggregated analysis.
Counts are recorded using TRAFx brand infrared (IR) pedestrian counters.
2020 Aggregated Count Data Report
March 10, 2021 – The following report includes the final adjusted infrared (IR) counter data from 20 multi use path locations in CT for 2020. This report reviews shifts in trail use levels and patterns impacted by the COVID-19 pandemic.
This is the fourth year of counts for all locations, except the Riverfront Recapture site in Hartford (added in late 2017) and three new sites: the Air Line Trail in Portland; Charter Oak Greenway in Manchester; and G & S Trail in Groton, (all added in summer 2019). Counts are recorded using TRAFx brand infrared (IR) pedestrian counters.
2019 Aggregated Count Data Report
March 17, 2020 – The following report includes the final adjusted infrared (IR) counter data from 20 multiuse trail locations in CT for 2019. This is the third year of counts for all locations, except the Riverfront Recapture site in Hartford (added in late 2017) and three new sites: the Air Line Trail in Portland; Charter Oak Greenway in Manchester; and G & S Trail in Groton, (all added in summer 2019). Counts are recorded using TRAFx brand infrared (IR) pedestrian counters.
The counts are being recorded using permanently installed TRAFx brand infrared (IR) pedestrian counters which were installed using manufacturer recommended methods. This trail user count effort is part of a larger multi-use trail data collection effort, the CT Trail Census, which is also collecting user information through intercept surveys.
2018 Aggregated Count Data Report
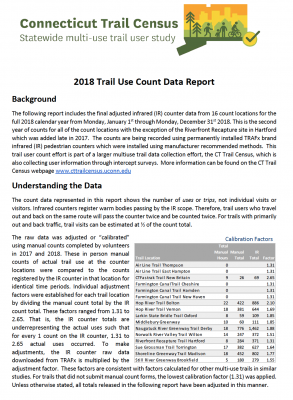
May 29, 2019 – The following report includes the final adjusted infrared (IR) counter data from 16 count locations for the full 2018 calendar year from Monday, January 1st through Monday, December 31st 2018. This is the second year of counts for all of the count locations with the exception of the Riverfront Recapture site in Hartford which was added late in 2017. The counts are being recorded using permanently installed TRAFx brand infrared (IR) pedestrian counters which were installed using manufacturer recommended methods. This trail user count effort is part of a larger multi-use trail data collection effort, the CT Trail Census, which is also collecting user information through intercept surveys.
2017 Trail Use Count Data Report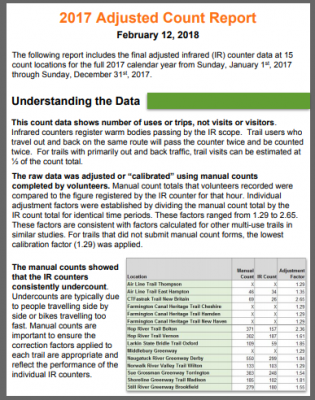
Feb, 2018 – The following report includes the final adjusted infrared (IR) counter data at 15 count locations for the full 2017 calendar year from Sunday, January 1st, 2017 through Sunday, December 31st, 2017.
Count Data File Downloads
Please use the links below to request the data file. the download link will be provided immediately upon form submission. We use this form to document the use of this data. Your information will not be shared or used for any other purposes.
-
2017 Infrared Count Data – Downloads as an Excel (xlsx) file
-
2018 Infrared Count Data 3-29-19 – Downloads as an Excel (xlsx) file
Be sure to view the “Read Me” section for important information on interpreting the survey data and its statistical validity.
Understanding the Count Data – Key Points
This data describes uses, not users
One of the most important points to note about the count data is that it shows number of uses or trips, not numbers of users or numbers of total visitors. Trail users will be counted every time they pass the counter, meaning that a trail user who takes an “out and back” route will be counted twice. All of the trail sections counted likely have a high percentage of these types of users, but it is difficult to calculate the percentage to be used in corrections. The published data from the Census therefore represents the number of trail trips or uses not trail users.
The data has been adjusted to account for error

There are some limitations to passive infrared counter technology in general, and the TRAFx counter specifically. First, the counters are not capable of determining the type of use so pedestrians, bicyclists, and any other user are indistinguishable in the count data. Second, there are multiple conditions that can result in error in the data including undercounting (due to occlusion or multiple people passing the heat sensor at the same time, undercounting due to traveling side by side, bikes pass the counter too fast, mechanical error, or technical failure.
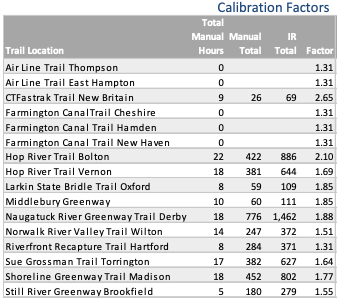
In order to account for the potential differences between the actual number of trail uses and what IR counters register, an adjustment factor is used to correct the raw counts for each trail. To complete a manual count, the volunteer is situated within view of the IR counter and records the actual number of people who pass by the counter. Coordinators are asked to conduct at least 10 hours of manual counts at the counter location annually which were compared to the counter records to determine the level of typical over or under count and calculate the appropriate adjustment factor.
The charts above display the adjustment factors used to adjust 2017 and 2018 raw data. Read more about adjustment factors on the Methodology page or in the individual year data reports.
Read the meta data
Each spreadsheet download on our website includes a “Read Me” tab with information about the data. We encourage you to take time to review this before using the data.
Interactive Data Portal
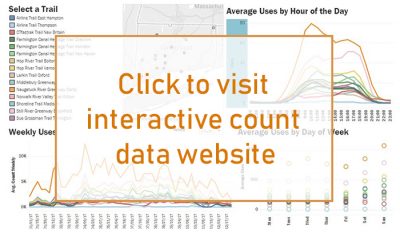
Provided by UCONN’s Center for Land Use Education & Research (CLEAR), this interactive data website shows up to date totals and patterns of trail use data. Navigate the website by clicking on the year at the top of the screen and then using your cursor to highlight specific trails and datasets.
This data portal illustrates trail use patterns in a simple and clear format which allows users to analyze trail use on specific trails and compare them to others included in the program. This data portal is to be updated every 3 months to provide accurate, up to date trail use data.